Health is wealth, eat well to live well.
Join my community and receive my free ebook! Subscribe now >>
Printable Blood Pressure Chart:
Download Your Copy Here
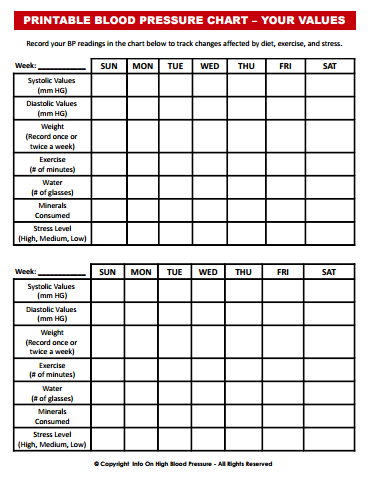
Having a printable blood pressure chart is a great way to track the changes of your blood pressure readings. There are other significant contributing factors caused by agrochemicals or genetically modified organism (GMO) foods and life situations when the changes of your readings are not determined by physical effort, emotional upheaval or tiredness.
Give your body a chance to heal itself and avoid toxin-rich but nutrient poor foods. If possible grow your own vegetables and eat organic foods that traditionally contains all the minerals, trace elements, enzymes and vitamins needed for good health.
So switch to a healthy, life-sustaining diet and lifestyle that will reverse most illness and help you to lose unnecessary weight.
Printable Blood Pressure Chart - Track Your Values
Download the form below to receive your free printable blood pressure chart. Track your values to determine what caused the changes to your blood pressure measurements. This will be of great benefit and information to you and to your health.

Including stress management into your blood pressure lowering practice is important. We cannot completely eliminate stress from our life but carving out some time each day to quiet your mind and try to totally relax your body will help tremendously.
Another suggestion is to change your attitude about exercising. Exercising is not just something you should do for your health, it is truly life-affirming. It can be fun. So from today onwards start thinking about it in a positive way, rather than it is something you must do but really don't want to do.
Look at exercising as a mood lifter, longevity program while lowering your blood pressure and getting healthier.
So get started and use your printable blood pressure chart and track your daily activities, it is one of the most important things you can do for your health. Measure your blood pressure and track all your blood pressure readings with a blood pressure chart.
Below I have listed the different categories and stages of hypertension for you to compare with your own blood pressure readings.
Blood Pressure Chart
| Date | Time | Systolic Values (mm Hg) | Diastolic Values (mm Hg) | Category |
|---|---|---|---|---|
| Below 120 | Below 80 | Normal blood pressure | ||
| 120-139 | 80-89 | Prehypertension | ||
| 140-159 | 90-99 | Stage 1 hypertension | ||
| 160 or more | 100 or more | Stage 2 hypertension |
Blood Pressure Chart
| Category | Normal Blood Pressure | Prehypertension | Stage 1 hypertension | Stage 2 hypertension | Date | Time |
Values For The Four Categories
| Systolic Values (mm Hg) | Below 120 | 120-139 | 140-159 | 160 or more | ||
| Diastolic Values (mm Hg) | Below 80 | 80-89 | 90-99 | 100 or more |
| Systolic Values (mm Hg) | ||||||
| Diastolic Values (mm Hg) | ||||||
| Systolic Values (mm Hg) | ||||||
| Diastolic Values (mm Hg) |
When To Measure Your Blood Pressure

- Measure your blood pressure after five to ten minutes of rest, while seated.
- Keep your arm at the level of your heart.
- Don't drink anything that will stimulate your blood pressure.
- Do not smoke for at least fifteen minutes before measuring your blood pressure.
- If you are over 65 years of age, your blood pressure should be measured both when you are standing and when you are sitting.
Remember your blood pressure readings differ in the evenings, and during the winter months. Also you may get a measurement of lower value in the mornings during the summer months.
It is recommended that you do your measuring for at least three consecutive days and write down these reading on your printed blood pressure chart. This way it will be easier for you to observe any minor or major changes in your blood pressure levels.
Return From Printable Blood Pressure Chart to Blood Pressure Chart


